Design System ROI
Company
Affirm
My Role
Design Manager
Getting buy-in for your design system can sometimes be challenging while also juggling feature work.
I am going to share with you how we measured the impact of Affirm’s Design System with meaningful metrics to present to management, teams, and stakeholders.


Overview
Why do we care about success measurements?
There are two reasons why do we need to measure the impact of the company’s design system:
- Adopting a new design system – management and stakeholders usually want to determine the feasibility and benefits
- After significant changes or updates to a design system – management and stakeholders want to learn how the changes impact cost, efficiency, usability, accessibility, workflows, and design handoff.
Design Systems are a major, long-term investment. We want to make sure we’re hitting our goals.
Goals
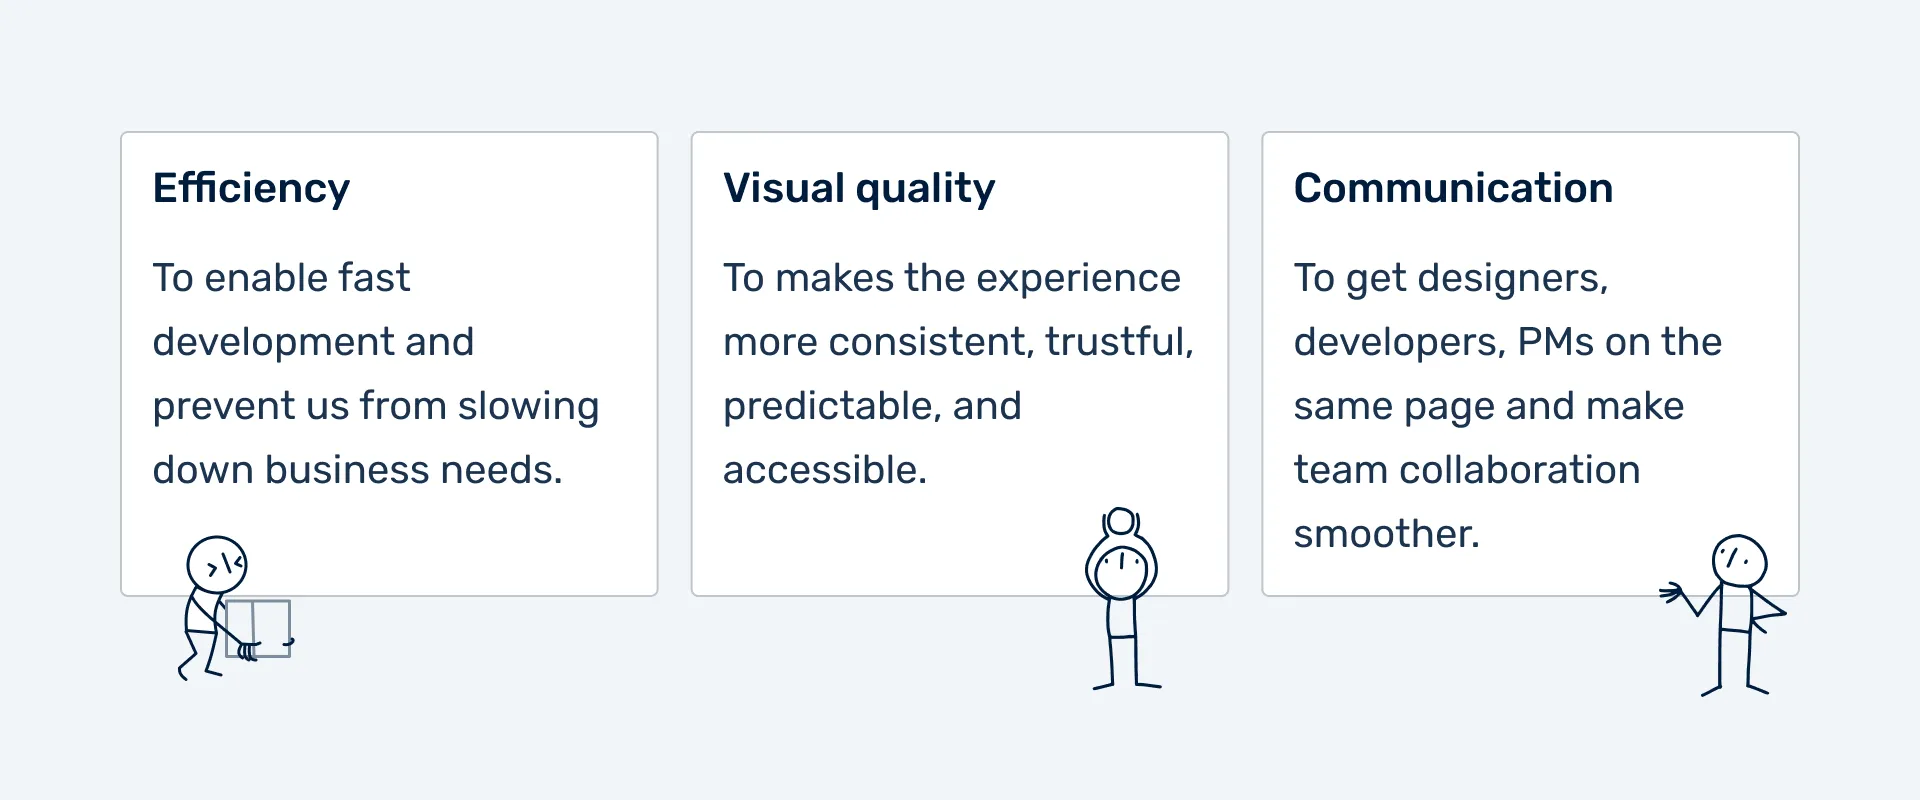
Who is our target audience?
Designers and engineers are our primary users. Quality engineers, writers, design managers, product managers, brand designers, eng. managers are our secondary users and stakeholders.

What can be measured?
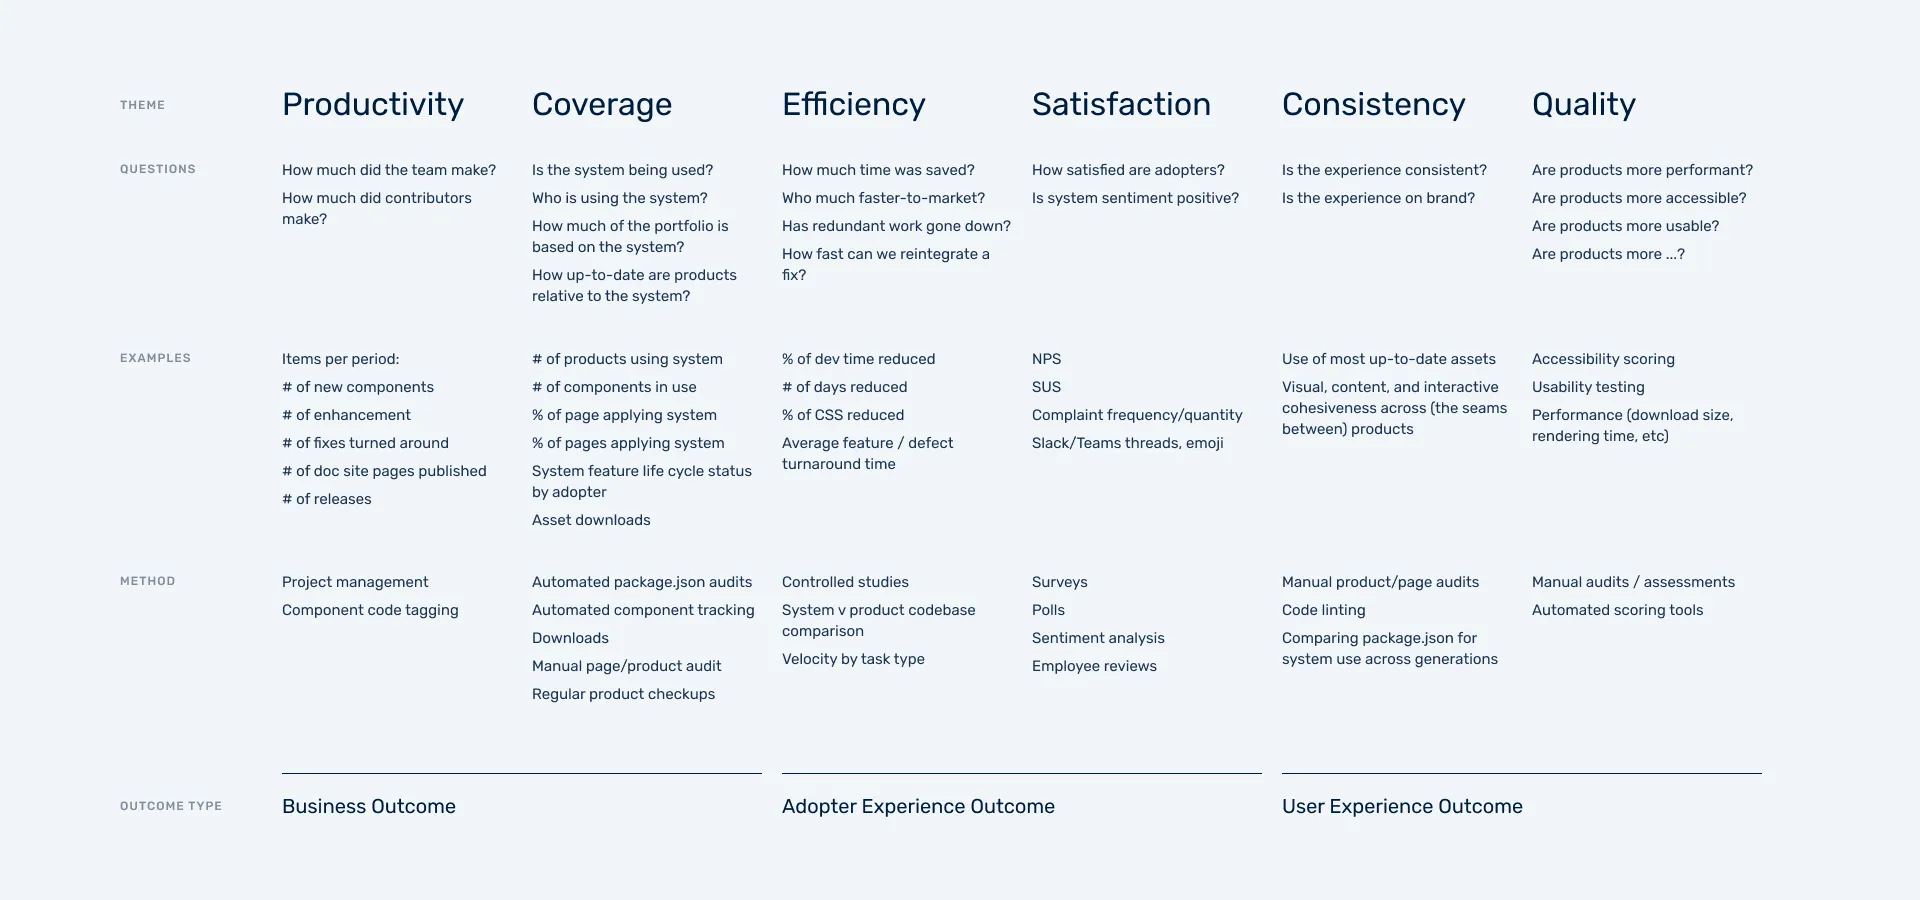
A lot of things can be measured through various channels using different methods. The most popular “themes” are:
What do we measure?
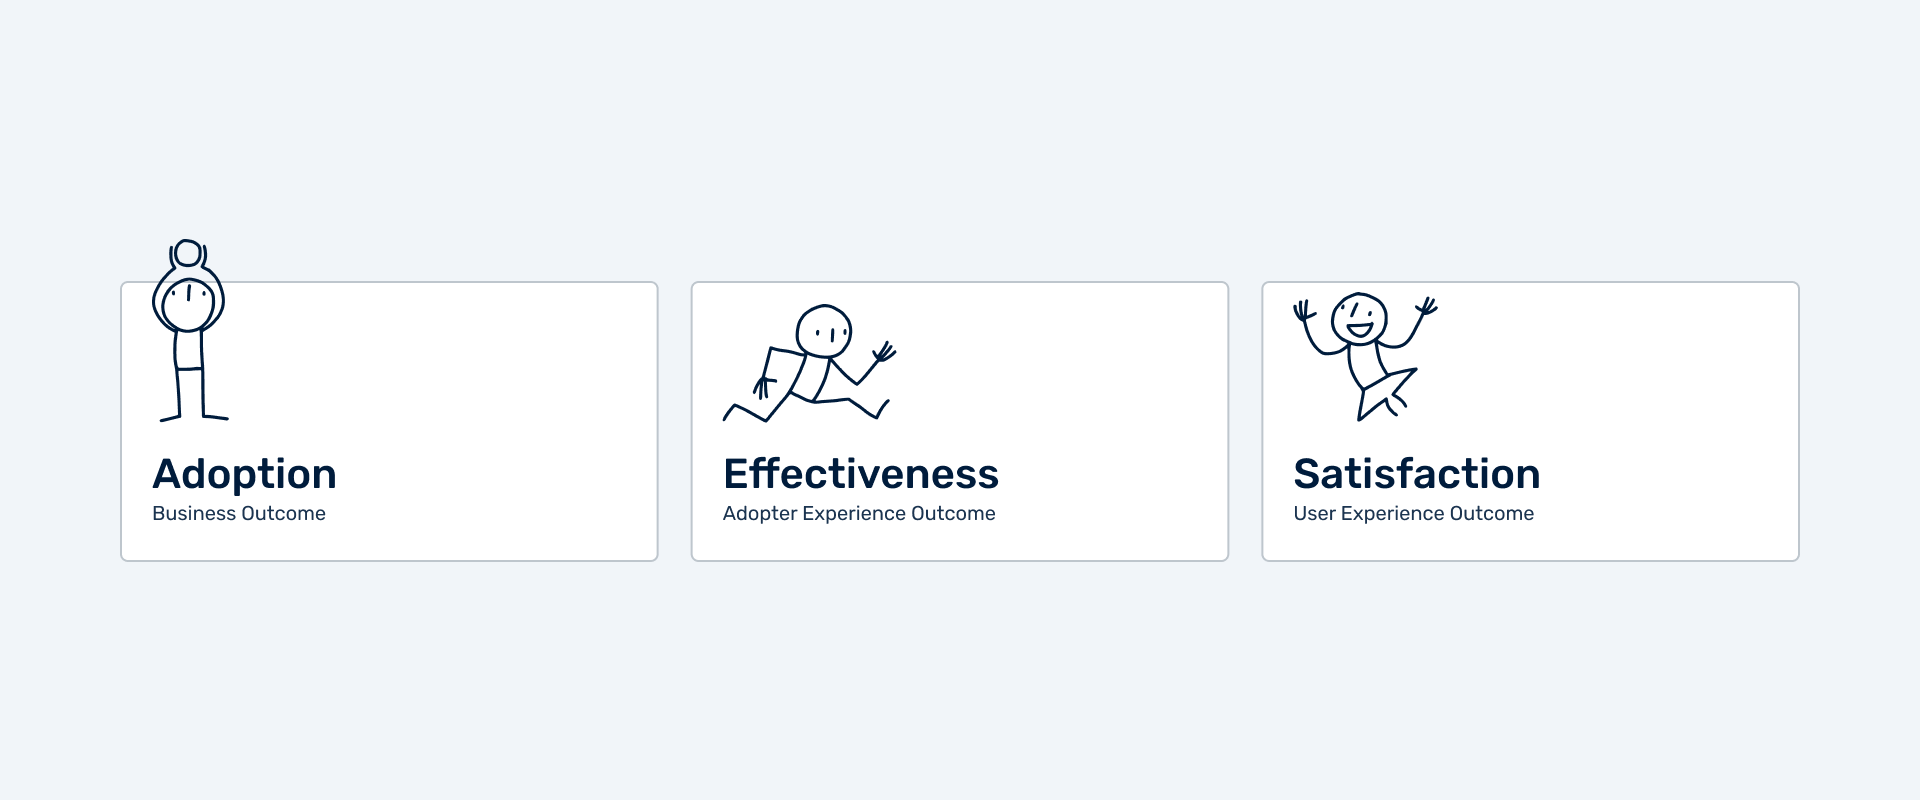
At Affirm we measure adoption, effectiveness and satisfaction.
How do we track these KPIs?
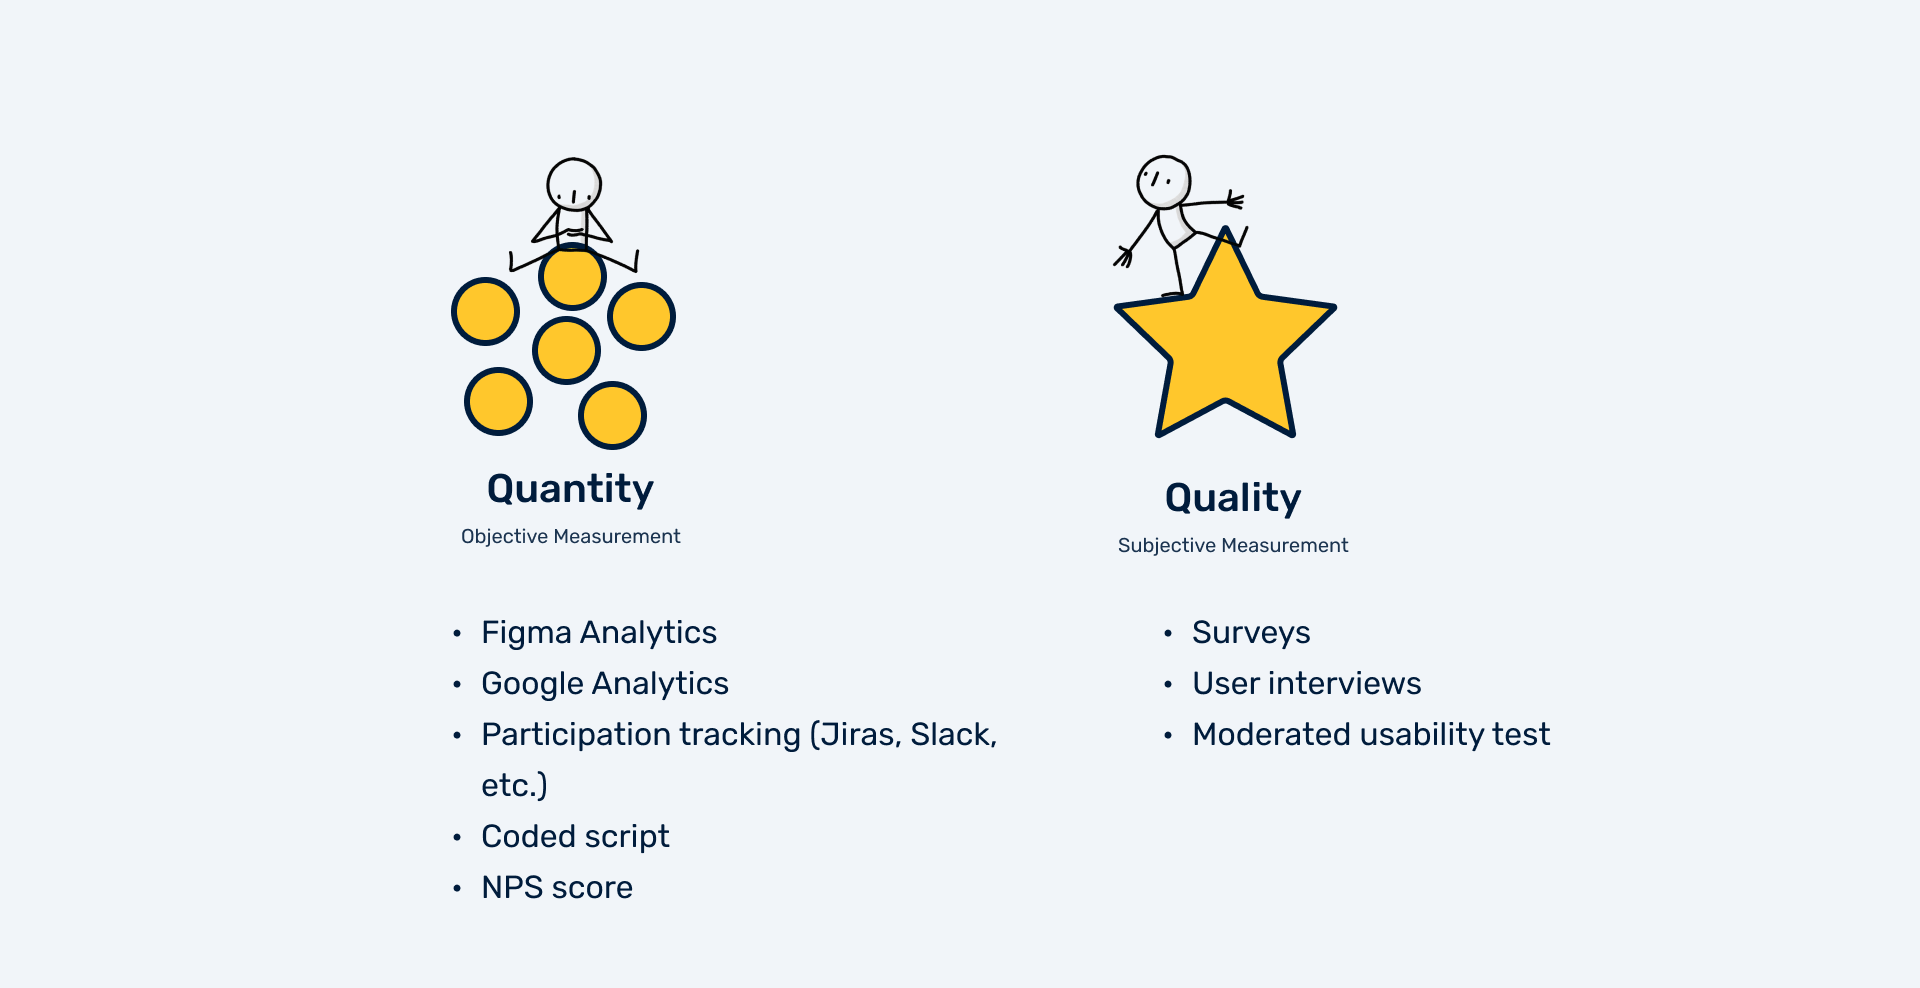
At Affirm, we track the impact of our Design System through a combination of quantitative and qualitative metrics to ensure it remains effective, scalable, and valuable for designers and developers.
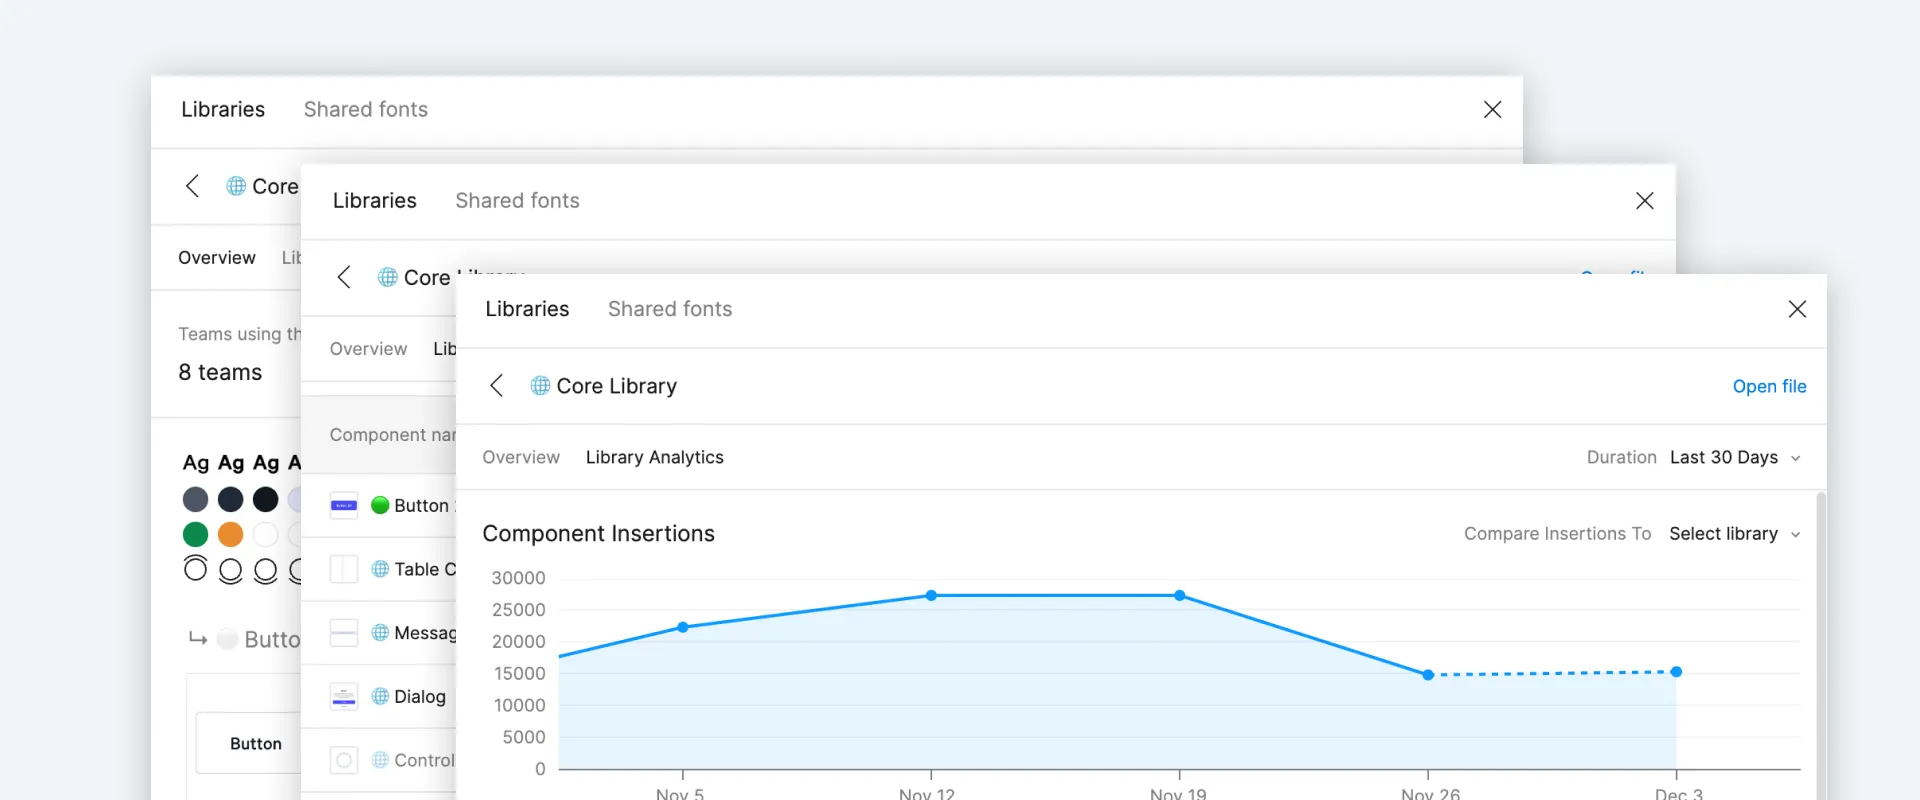
Figma Analytics
Tracking component usage, detached components, and linting issues to assess adoption and consistency.
Google Analytics
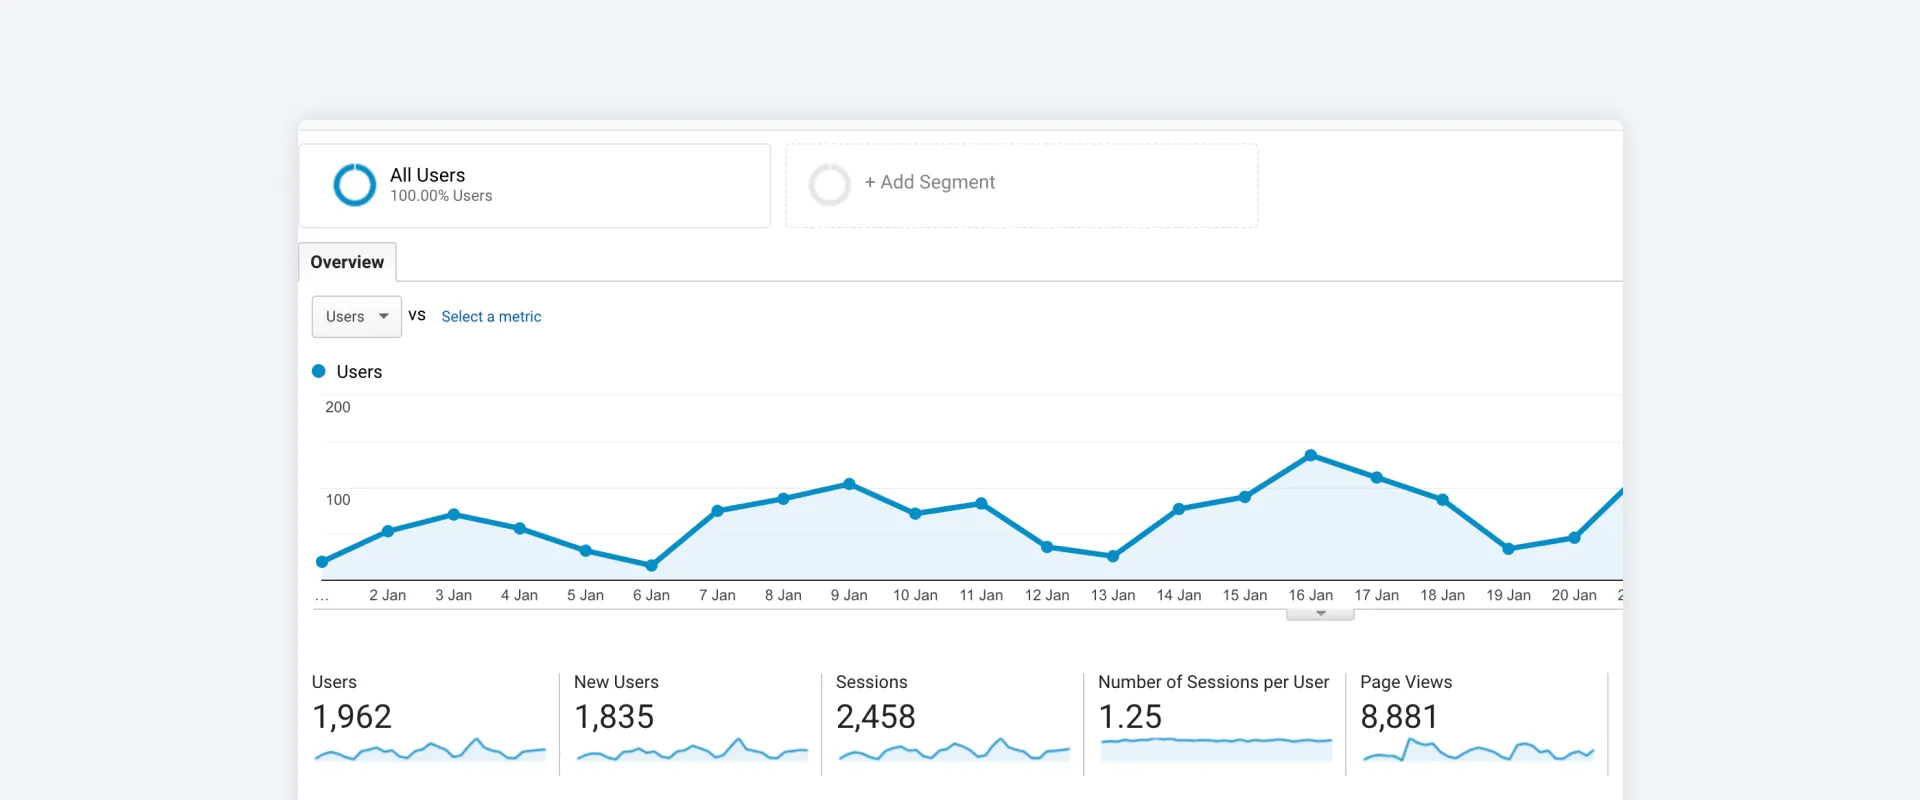
Measures engagement with Supernova.io documentation, tracking visits, time spent, and search behavior to understand accessibility and usefulness.
Participation Tracking
Monitors Slack discussions, Jira tickets, and support requests to gauge how often teams interact with and need guidance on the system.

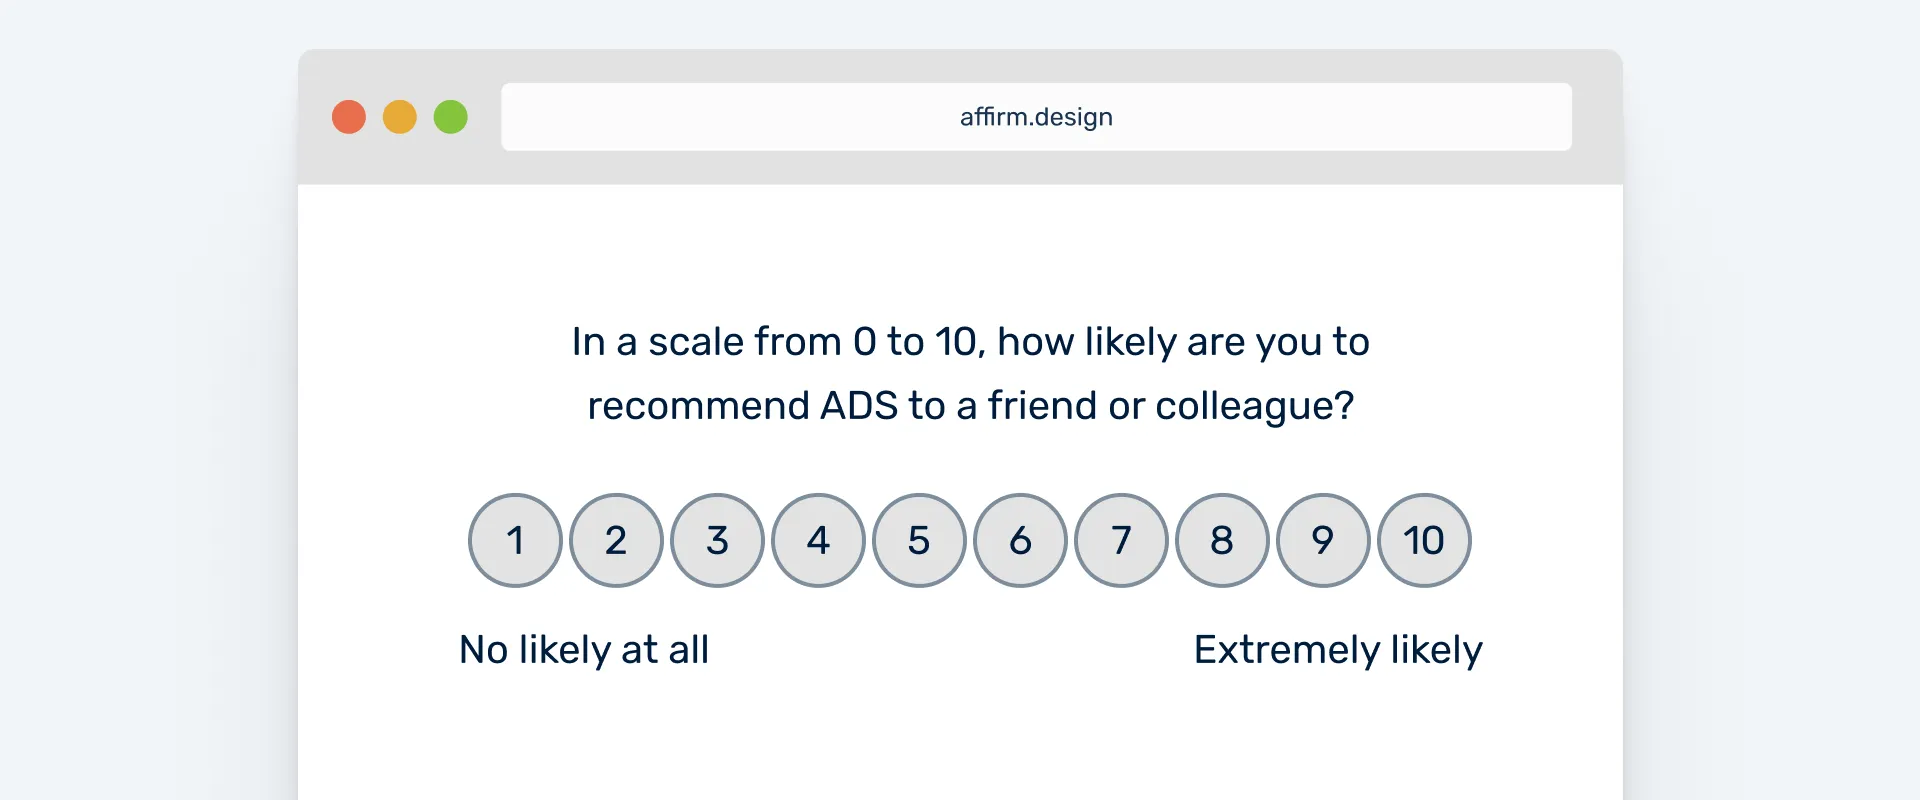
Net Promoter Score (NPS)
Evaluates user satisfaction and advocacy, measuring how likely teams are to recommend the system.
Code Analytics
Tracks developer adoption by analyzing code changes per release, component usage rates, and reliance on custom CSS to understand technical integration.

Surveys
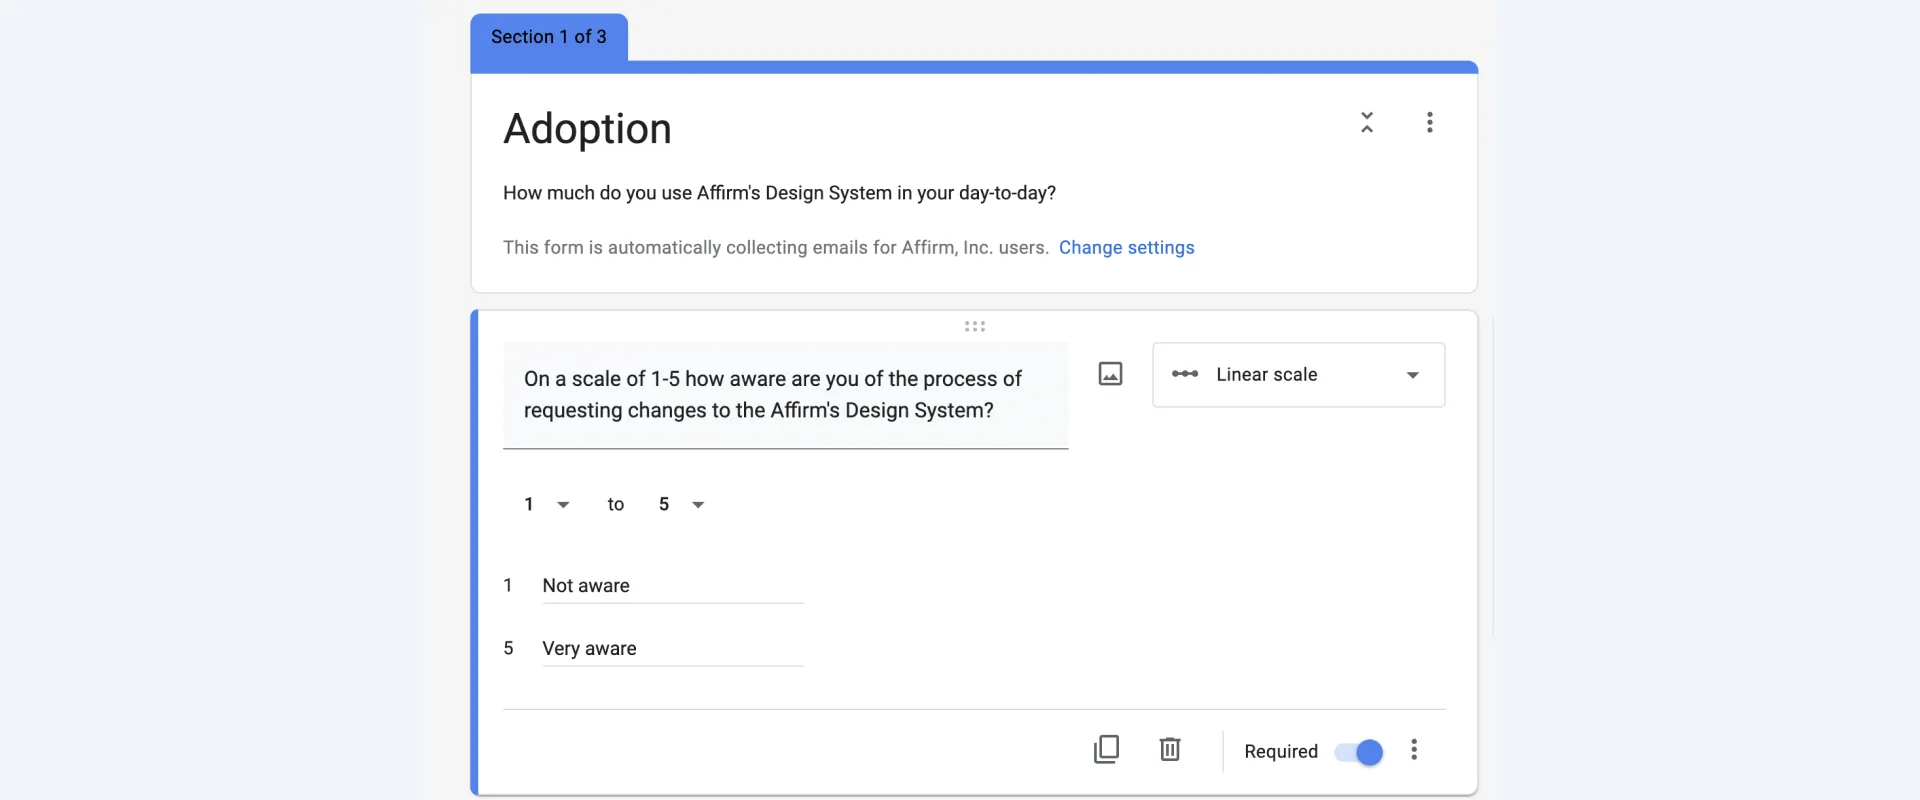
Collects direct user feedback on:
- Usage frequency of the Design System
- Areas for improvement
- Workflow impact, using a 1-5 scale on how much the system improves efficiency
User Interviews
Conducts in-person and Slack-based interviews to gather deeper insights on user pain points and successes.
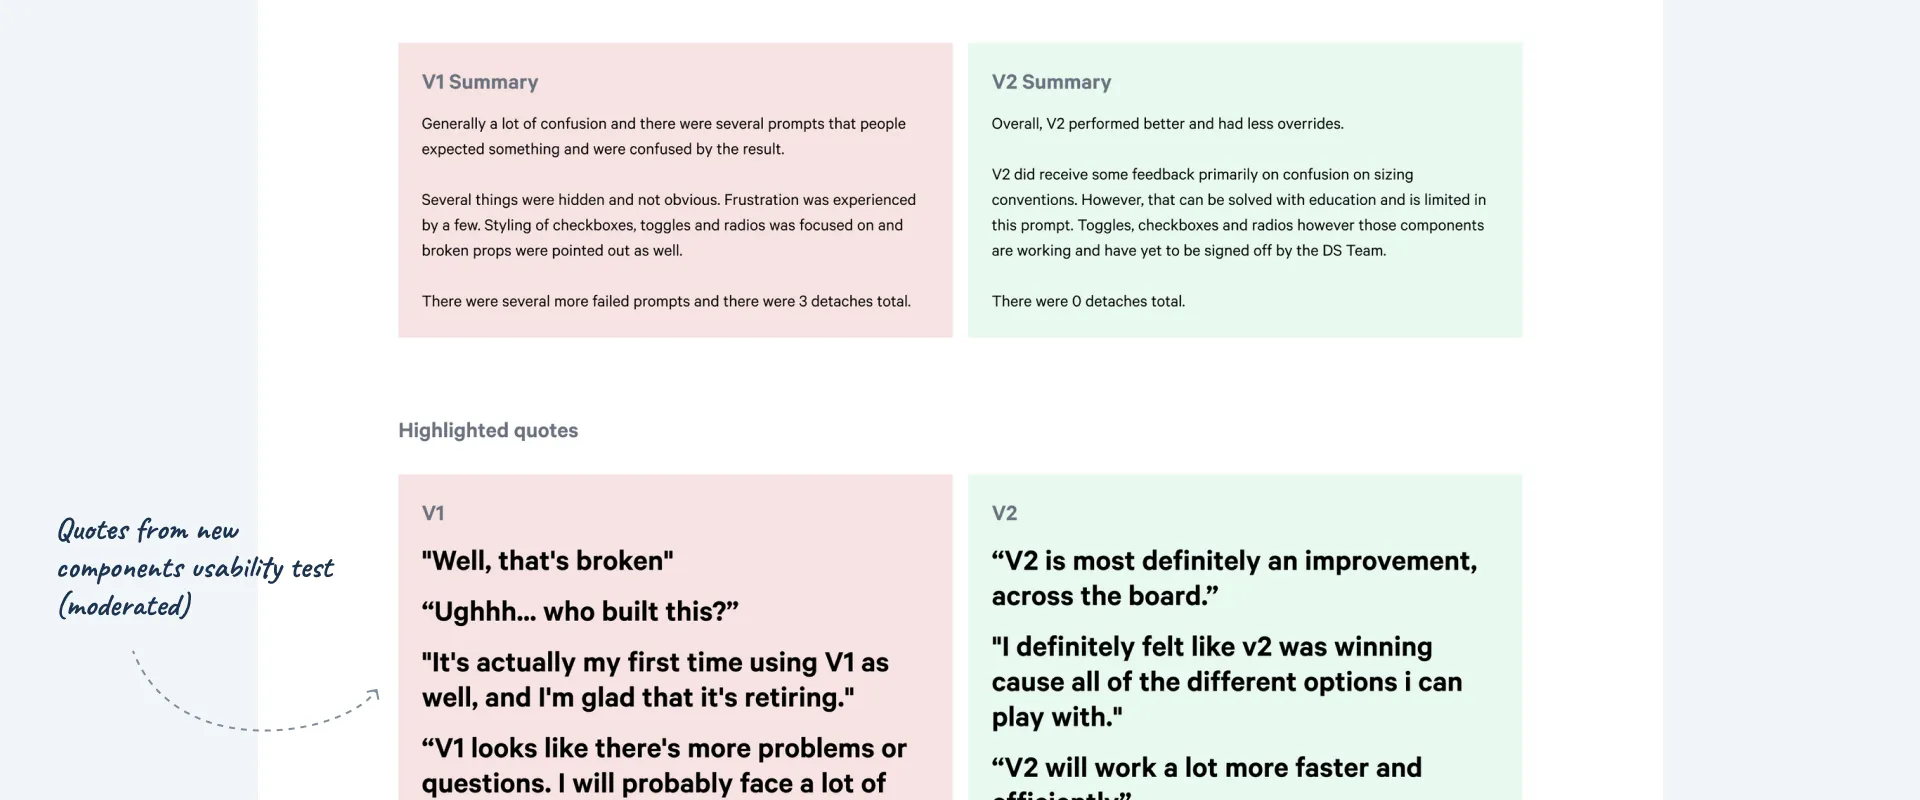
Quarterly Report
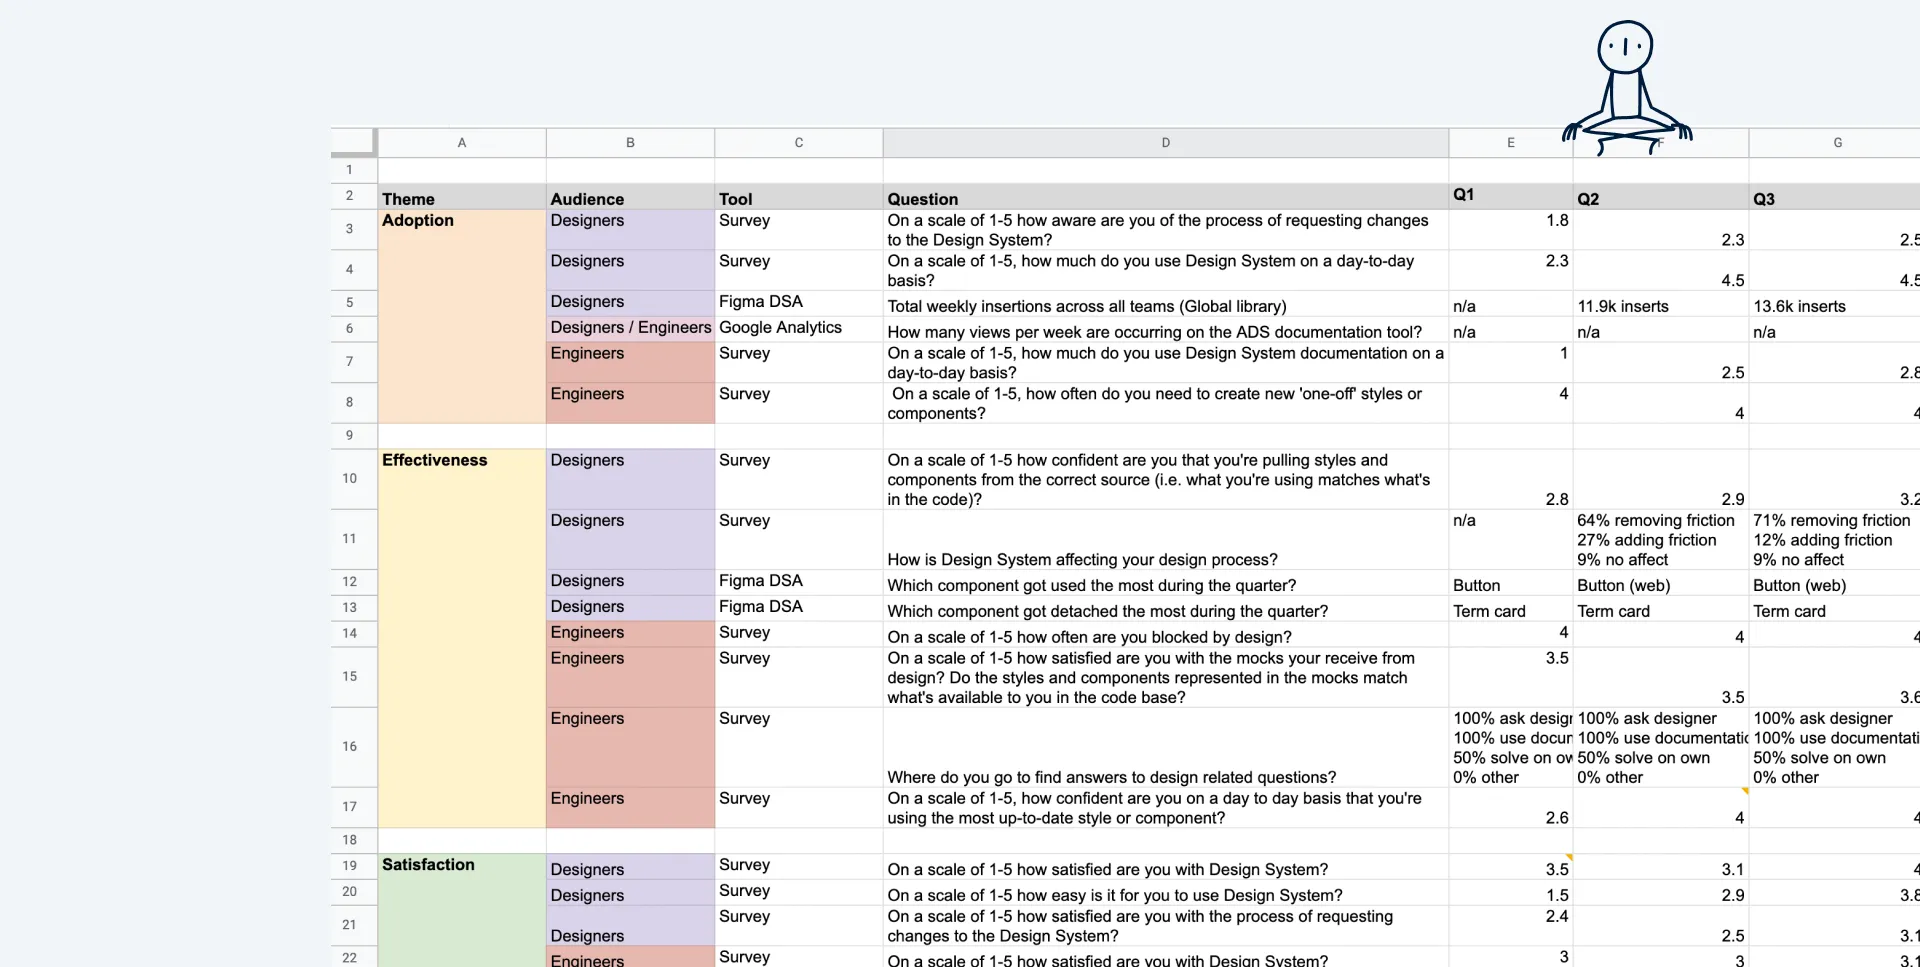
Every quarter, we compile data from our Design System metrics to create a comprehensive Quarterly Report for upper management.
This report highlights adoption trends, efficiency gains, user satisfaction, and areas for improvement, providing a clear picture of how the Design System drives business value.
Results
By showcasing measurable impact—such as reduced design debt, increased development speed, and improved product consistency—we ensure continued investment and alignment with company goals.
This data-driven approach reinforces the strategic importance of the Design System and informs future enhancements.
Thank you for scrolling all the way!


Design System ROI
Company
Affirm
My Role
Design Manager
Getting buy-in for your design system can sometimes be challenging while also juggling feature work.
I am going to share with you how we measured the impact of Affirm’s Design System with meaningful metrics to present to management, teams, and stakeholders.

Overview
Why do we care about success measurements?
There are two reasons why do we need to measure the impact of the company’s design system:
- Adopting a new design system – management and stakeholders usually want to determine the feasibility and benefits
- After significant changes or updates to a design system – management and stakeholders want to learn how the changes impact cost, efficiency, usability, accessibility, workflows, and design handoff.
Design Systems are a major, long-term investment. We want to make sure we’re hitting our goals.
Goals
Who is our target audience?
Designers and engineers are our primary users. Quality engineers, writers, design managers, product managers, brand designers, eng. managers are our secondary users and stakeholders.
What can be measured?
A lot of things can be measured through various channels using different methods. The most popular “themes” are:
What do we measure?
At Affirm we measure adoption, effectiveness and satisfaction.
How do we track these KPIs?
At Affirm, we track the impact of our Design System through a combination of quantitative and qualitative metrics to ensure it remains effective, scalable, and valuable for designers and developers.
Figma Analytics
Tracking component usage, detached components, and linting issues to assess adoption and consistency.
Google Analytics
Measures engagement with Supernova.io documentation, tracking visits, time spent, and search behavior to understand accessibility and usefulness.
Participation Tracking
Monitors Slack discussions, Jira tickets, and support requests to gauge how often teams interact with and need guidance on the system.
Net Promoter Score (NPS)
Evaluates user satisfaction and advocacy, measuring how likely teams are to recommend the system.
Code Analytics
Tracks developer adoption by analyzing code changes per release, component usage rates, and reliance on custom CSS to understand technical integration.
Surveys
Collects direct user feedback on:
- Usage frequency of the Design System
- Areas for improvement
- Workflow impact, using a 1-5 scale on how much the system improves efficiency
User Interviews
Conducts in-person and Slack-based interviews to gather deeper insights on user pain points and successes.
Quarterly Report
Every quarter, we compile data from our Design System metrics to create a comprehensive Quarterly Report for upper management.
This report highlights adoption trends, efficiency gains, user satisfaction, and areas for improvement, providing a clear picture of how the Design System drives business value.
Results
By showcasing measurable impact—such as reduced design debt, increased development speed, and improved product consistency—we ensure continued investment and alignment with company goals.
This data-driven approach reinforces the strategic importance of the Design System and informs future enhancements.
Thank you for scrolling all the way!


